Trying to chart classroom PC activity
I’ve long had the idea to make something using data from Active Directory. My most recent attempt is an activity “heatmap” for desktops at my university.
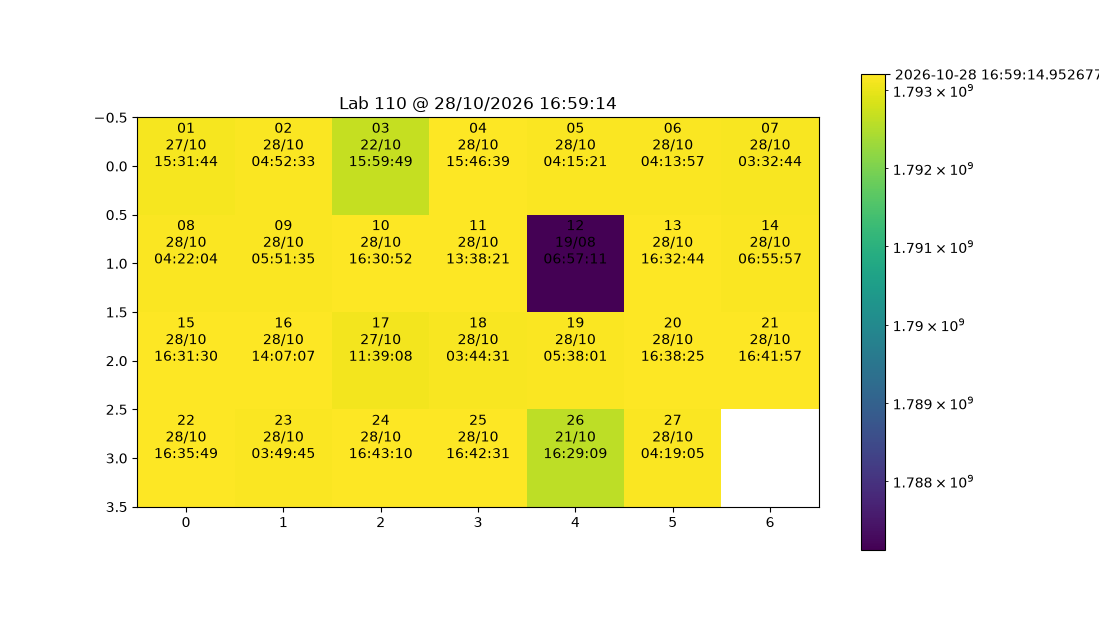
It uses a script to search on one or more domain controllers, compare lastlogon on each set of results, and save the latest timestamps into a JSON file.
A Python script uses pyplot to render the chart, which is the image you see above!
I eventually want to make an automated page for this, and possibly look into other fun stats. Though it’d be hard to keep up to date when off campus.
If you want, you can check the GitHub repository here. :)